As part of my analysis on the state of cloud providers in the market, this time I carried out a broader measurement to obtain the factor that I have called “Benchcfe” which basically translates into a metric to determine the cost per efficiency of a unit of compute (VM, instance or even Bare Metal).
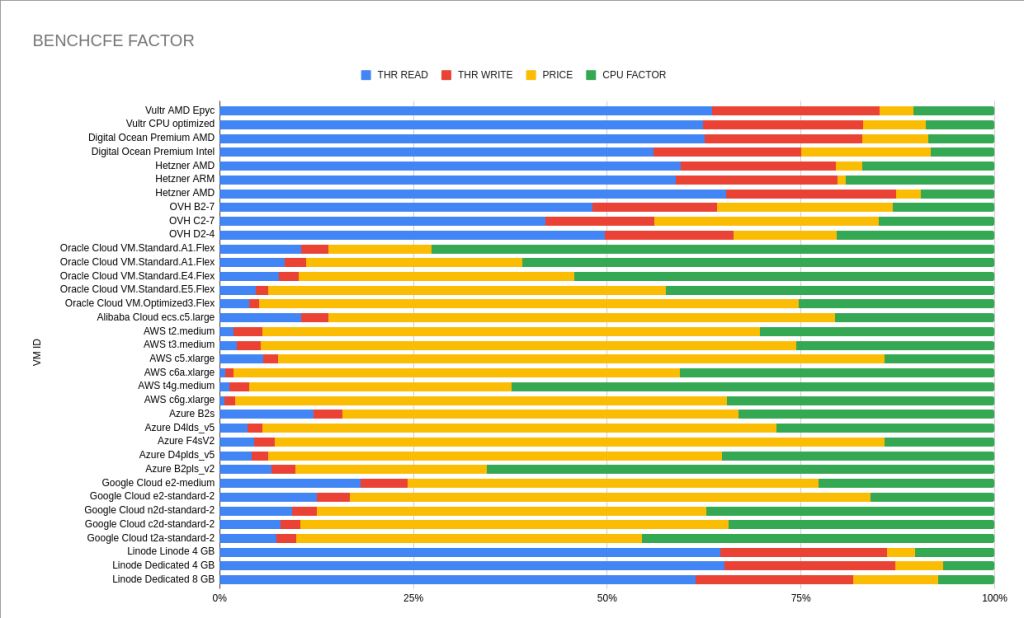
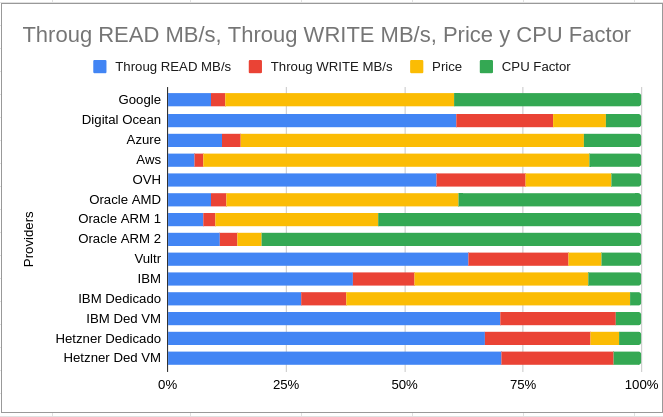
Reading the graph is quite simple but significant: the blue lines refer to the reading throughput, the reds for the writing, the greens in relation to the CPU performance and finally the yellows indicate the total cost in relation to the performance that they offer (Benchcfe), the larger the size of the yellow line and the smaller the size of the rest means that the product is much more expensive and offers less overall performance.
Due to some comments on my previous article, I sought to expand the study, testing various versions of instances offered by providers.
To achieve this, the first thing I did is create a bash script that allows us to obtain the necessary values that must be taken to a table for the respective calculations, you can find it in this repository.
The results are very interesting in general and in particular I still find it incredible the abysmal difference in performance offered by the big ones (Azure, Aws, G-Cloud) in relation to the smaller ones (Digital Ocean, Vultr, Hetzner, Linode), the latter they become up to 100 times more efficient in many aspects.
On the other hand I found a serious problem in AWS: when a large file is generated, say 16 GB, the disk read/write performance is drastically reduced to scary IOPS, that problem may be due to infrastructure failures, on sale or some bug in the data bus, my tests were only sent to one data center but I will soon do more validations and check if it is generalized or only in Virginia (US).
I added something additional to the analysis: a speed benchmarking between data centers and instances, especially useful now that we want to expand our data centers, integrate them with a multi-site approach. I was pleasantly surprised with the performance that Azure offers in general to connect with various providers, in many cases exceeding 1 GB/s, which does allow two or more networks to be integrated.
At the company, Aputek, we work with big data and due to various circumstances we distribute all our infrastructure in various data centers, this is due to regulatory issues, costs, performance, in short… The thing is that we work with 8 different cloud providers and reviewing our statistics on productivity and costs that we have been incurring, I began to do something that I had never tried: evaluate the economic efficiency based on performance and performance of our suppliers. It was not an easy task because our compute (instances) units are different in each provider and I needed to generate the metrics with what we already have. I made an exception to this with Vultr (the 9th one) where I raised a VM to add it to my studio.
This article can be very dense but I am going to focus only on the key results for my case and towards the end I will share the tables and formulas that I developed to calculate everything that I expose.
I focused on the efficiency of the CPU based on two cores, as well as the throughput of the disks and even the network drives. I discarded the memory factor because although it impacts many operations, there is a great variety of options (flavors) and it is associated with the requirements of the applications that are going to be executed. Another no less important factor is only taking as a model, the virtual machines or bare metal (yes there are 2) of standard configuration, without major complexities, considering that yes with SSD disks.
The machines that I have used, as I mentioned, are part of many of our data clusters in various data centers from various providers, some do scraping tasks, massive data processing, real-time analytics, machine learning, IOT processing, and clinical equipment. or simply support microservices from our solutions.
I must add that this article is not intended to select the best cloud provider, but simply to obtain a metric to make better decisions based on the provider we work with. There is also an important factor: acquiring a virtual machine (or bare metal) does not solve much for us, it can be part of our architecture to develop a service, but there are many additional associated costs: from the type of CPU, the size, and the speed of the disk. , incoming and outgoing traffic, security images, ips, etc. Each one offers various advantages in this regard, to cite a small example: Digital Ocean offers a VM with 2 CPU / 4 GB RAM with 80 GB of disk and 4 TB of data transfer all USD 24.00, meanwhile IBM offers the same machine with 25 GB of disk and only 250 GB of transfer for USD 58.52. In summary: there are many components that we must evaluate to support our infrastructure, but in many cases the center will be the VM (unless you do everything serverless).
Having made all the clarifications of the case, I will concentrate on the subject of my study. To measure the performance of the CPU I used SYSBENCH considering only 2 cores and for the storage (disks and network drives) FIO the creation of a 4 GB file. I carried out the process 5 times in each scenario, I showed the best data obtained in the table and graphs. I added two bare metal (of several we have) to all of this to help further focus the value I wanted to find.
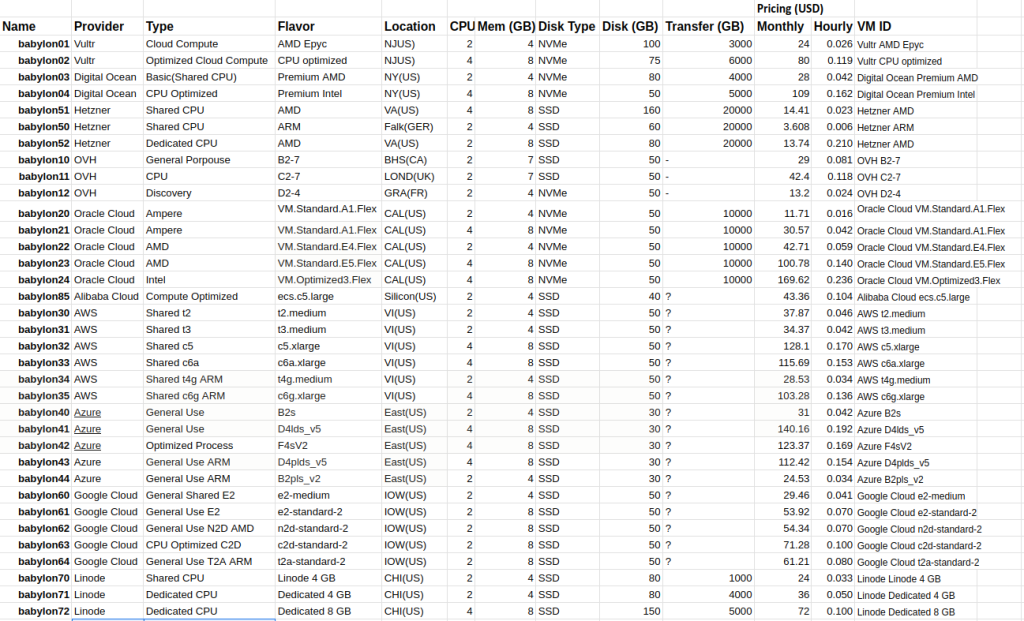
The table below shows all the information obtained and tabulated, starting from this I began to highlight the most relevant data and develop my factor.
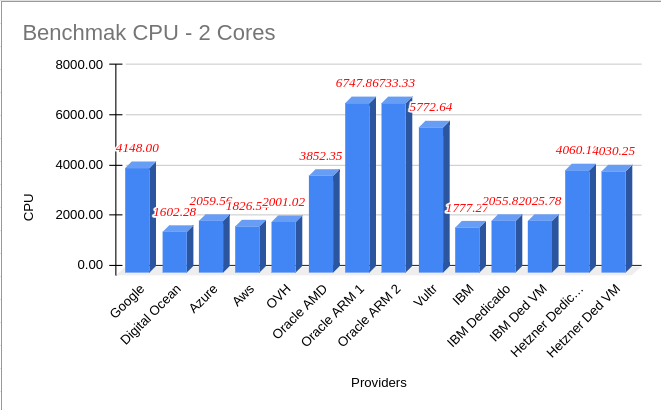
Compute Benchmarks
First interesting fact: the highest CPU performance with the lowest cost on the market on this list is from Oracle with its ARM instances, and to top it off they offer you 8 CPUs and 24 GB of ARM RAM for whatever you want at no cost per month forever (at least until it is no longer the case). We use it in scraping and it is really delicious.
CPU Benchmarks
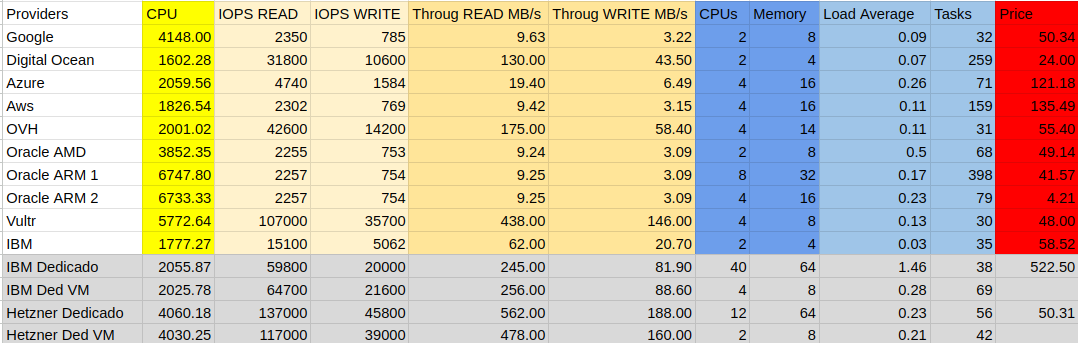
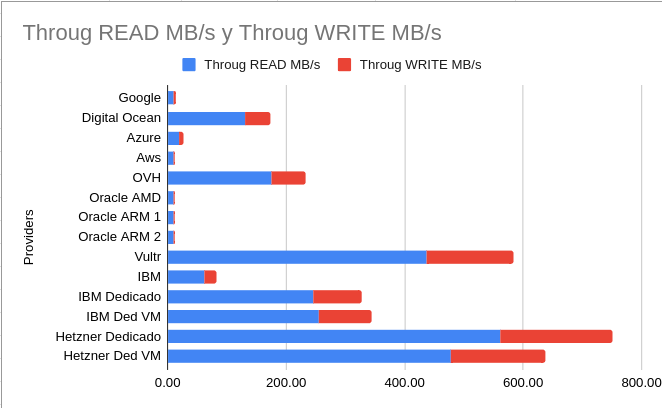
In terms of storage performance (disks) we have that the big winners are Hetzner and Vultr, the difference in reading and writing is more than 50 times between some providers. Can you imagine running a database, storing images for analytics or any task that requires disk speed? At this point, many vendor “architects” will tell you how to do it in the most efficient way at a cost that is surely more prohibitive by adding a series of services that they offer. On this point I want to tell a little anecdote: a couple of years ago we went to the offices of one of our cloud providers to get “advice” on how to improve what we already had, particularly our scraping component that requires hundreds of robots to launch in a synchronized way taking advantage of each request and therefore all the information we obtain must be processed and stored in a database, in this case postgresql, it is true that we used redis as an intermediate solution but at a certain moment we had to save 8270 data per second. The postgresql solution offered by this provider only allowed me 105 writes per second and also had to consider the number of CPUs, storage, etc. which made the cost of the service 10 times more than a VM. My solution was: we set up our postgresql cluster on the machines and saved our data without the restrictions that the provider’s solution had (which, by the way, they didn’t know they had).
Disk Throughput
After many calculations, taking averages of offered instances, factoring CPU cost, relating it to storage, etc, etc. I got what I wanted: a table showing me the providers with the best CPU, Disk and Price performance. The yellow line is careful, it indicates how much the product (the instance, VM) is worth in relation to what it offers, where we have Hetzner, Vultr and Oracle ARM very good options.
Value Factor by Compute Unit
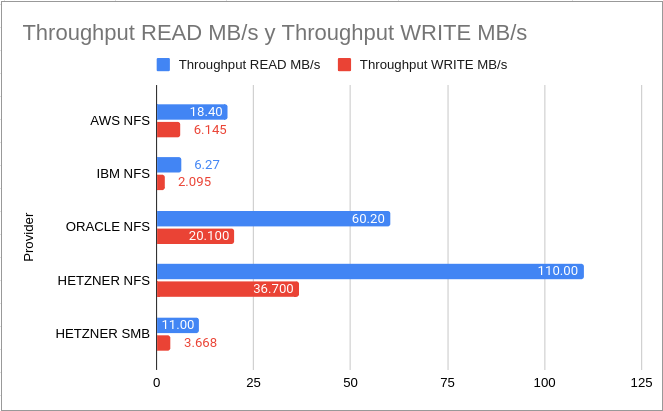
When we work with data clusters, Kubernetes for example, we will always need shared network drives for all the data and there, depending on what we pay, we can store the data in common, images, databases etc Remember that if this test has been done with standard configuration without adjusting the IOPS, if one does that, the cost can rise X times and it is something that we must consider. Here Oracle stands out, but in the case of Hetzner, since they do not offer a redundant storage solution in their infrastructure, we had to make one with a cluster of nodes, which obviously triggers performance because it is something ad hoc.
I hope this study helps you make better decisions when dealing with your cloud architecture and to avoid controversy I am sharing the sources I recorded and the calculations (subject to validation) I made for the Value Factor by Compute Unit. I will be attentive to your comments.


You must be logged in to post a comment.